|
National University of Educational Planning and Administration (NUEPA), has released Elementary Education in India: Progress towards Universal Elementary Education, DISE, Flash Statistics: 2007-08. District Information System for Education (DISE) is one of the major activities of Sarva Shiksha Abhiyan programme initiated by the Government of India. District elementary education plans across the country are primarily based on the DISE data. The data for the year 2007-08 was recorded on 30th September 2007 and received from 1.25 million recognised schools imparting elementary education spread over 624 districts in all the 35 States and UTs of the country. Unlike other surveys, DISE is complete enumeration of the recognised schools and frequency of data collection is annual, 30th September each year. Major Highlights NUEPA has created a comprehensive database on elementary education in India known as District Information System for Education (DISE), under one of its most prestigious projects. The project covers both primary and upper primary schools/sections of all the districts of the country. The MIS Units are now operational both at the district and state levels and are equipped with necessary hardware and software. The DISE software is also operational in all the districts of the country and is providing vital information for policy formulation and preparation of district elementary education plans. What is more remarkable about DISE is that it has drastically reduced the time-lag in the availability of educational statistics which is now down from 7-8 years to less than a year at the national level and only a few months at the district and state levels. Some of the major highlights of DISE 2007-08 data are presented below. For details, please refer DISE Flash Statistics: 2007-08, NUEPA & MHRD, Government of India, January 2009. Number of districts covered under DISE increased from 609 in 2006-07 to 624 in 2007-08 Number of schools increased from 1.20 million in 2006-07 to 1.25 million in 2007-08 Percentage of Government schools declined from 80.82 in 2006-07 to 80.18 in 2007-08 About 109528 primary and 39726 upper primary schools have been opened between the period 2002-03 to 2007-08 Ratio of Primary to Upper Primary schools further improved to 2.41 in 2007-08 from 2.45 in the previous year On an average an elementary schools/section functioned for 211 days in 2007-08 About 73% schools have pucca building in 2007-08 compared to 71 percent in 2006-07 On an average, primary schools had 3.0 classrooms in 2007-08 compared to 2.8 in 2006-07 About 74 percent classrooms in 2007-08 are of good condition compared to 73 percent in 2006-07 Student-classroom ratio improved to 37 in 2007-08 from 35 in 2006-07 The percentage of primary schools with student-classroom 60 and above declined to 13.97 percent in 2007-08 from 17.44 percent in 2006-07 Percentage of single-teacher schools declined to 10.13 percent in 2007-08 from 11.76 percent in 2006-07 Percentage of female teachers increased tom72.88 percent in 2007-08 from 71.74 percent in 2006-07 Percentage of schools with drinking water facility improved to 86.75 percent in 2007-08 from 84.89 in 2006-07 Percentage of schools with common toilets increased to 62.67 in 2007-08 from 58.13 percent in 2006-07 Schools with girls toilet increased to 50.55 in 2007-08 from 42.58 percent in 2006-07 More than 14 percent schools now have computers in schools compared to 13 percent in 2006-07 Percentage of schools with ramps increased to 34.43in 2007-08 from 26.61 in 2006-07 36 percent schools had kitchen-shed in schools in 2007-08 compared to 36.06 percent in 2006-07 Enrolment in primary classes increased to 134 million in 2007-08 from 132 million in 2006-07 Upper Primary enrolment increased to 50.9 million in 2007-08 from 47.49 million in 2006-07 Percentage of girls enrolment in primary and upper primary classes increased to 48.22 and 46.99 percent in 2007-08 from 48.09 and 46.51 in 2006-07 respectively Percentage of SC enrolment in elementary enrolment is 19.83 percent compared to 10.95 ST and 42.22 OBC enrolment Percentage of Muslim enrolment in primary classes increased to 10.49 in 2007-08 from 9.39 in 2006-07. Corresponding figures in upper primary enrolment is 8.54 and 7.52 per cent Average repetition rate in primary classes declined to 6.02 percent in 2007-08 from 6.11 percent in 2006-07 Retention rate at primary level improved to 74 percent in 2007-08 from 70 percent in 2006-07 Gross enrolment Ratio at primary level increased to 113.94 percent in 2007-08 from 110.86 percent in 2006-07 Net enrolment Ratio at primary level increased to 95.92 percent in 2007-08 from 92.75 percent in 2006-07 GER at upper primary level increased to 69.88 in 2007-08 from 64.72 in 2006-07. NER at upper primary level increased to 52.55 percent in 2007-08 from 48.45 in 2006-07 Percentage of Boys and Girls passing with 60 percent and more marks in Grade IV/V increased to 48.67 and 48.80 in 2007-08 from 44.96 and 45.12 in 2006-07 Percentage of Boys and Girls passing with 60 percent and more marks in Grade VII/VIII increased to 43.02 and 44.05 in 2007-08 from 38.83 and 40.06 in 2006-07 Educational Development Index (EDI): 2007-08 It is for the last three years that NUEPA has been computing Educational Development Index and assign ranks to states. A set of 23 indicators have been used to compute EDI separately at primary, upper primary and composite primary and upper primary levels of education. These indicators are sub grouped under access, infrastructure, teachers and outcome indicators. Policy options have been explored for the first time to identify best and worst values in case of few variables. The five Top and Bottom states, along with respective EDI values have been presented below: At the Primary level, Puducherry with EDI value 0.799 is ranked first followed by Delhi, Lakshadweep, Tamil Nadu and Kerala (0.766). The bottom ranked states are Bihar (EDI, 0.389), rank 35th followed by Arunachal Pradesh, Jharkhand, Assam and Meghalaya (EDI, 0.527). The highest value of EDI may be 1.000. At the Upper Primary level, Kerala with an EDI value 0.842 is ranked first followed by Lakshadweep, Puducherry, Chandigarh and Delhi (EDI, 0.793). Bihar is also ranked 35th with an EDI value 0.424 followed by West Bengal, Jharkhand, Arunachal Pradesh and Chhattisgarh (EDI, 0.567) 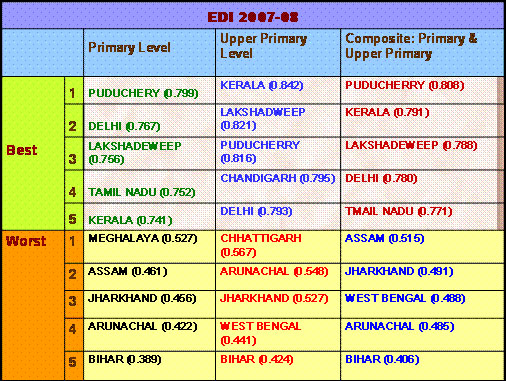 So far as the composite Primary and Upper Primary levels is concerned (Elementary level of education), it is Puducherry (EDI, 0.808) which is ranked first and Bihar (EDI, 0.406) is ranked 35th. Kerala is ranked second followed by Lakshadweep, Delhi and Tamil Nadu. On the bottom side, Bihar is followed by Arunachal Pradesh, West Bengal, Jharkhand and Assam (EDI, 0.515). |
|
|
PRESS INFORMATION BUREAU, January 19, 2009 |